
Read the marketing dashboard看懂营销仪表板
Which channels produce paying families, not just enquiries — and what each customer actually costs you.哪些渠道带来会付钱的家庭,而不只是询问——以及每位客户实际花了你多少。
这篇指南的正文目前只有英文版。标题、摘要与导览已翻译;内文仍在翻译中。
Reports → Marketing Dashboard turns the daily entries into the four questions worth asking about your marketing.
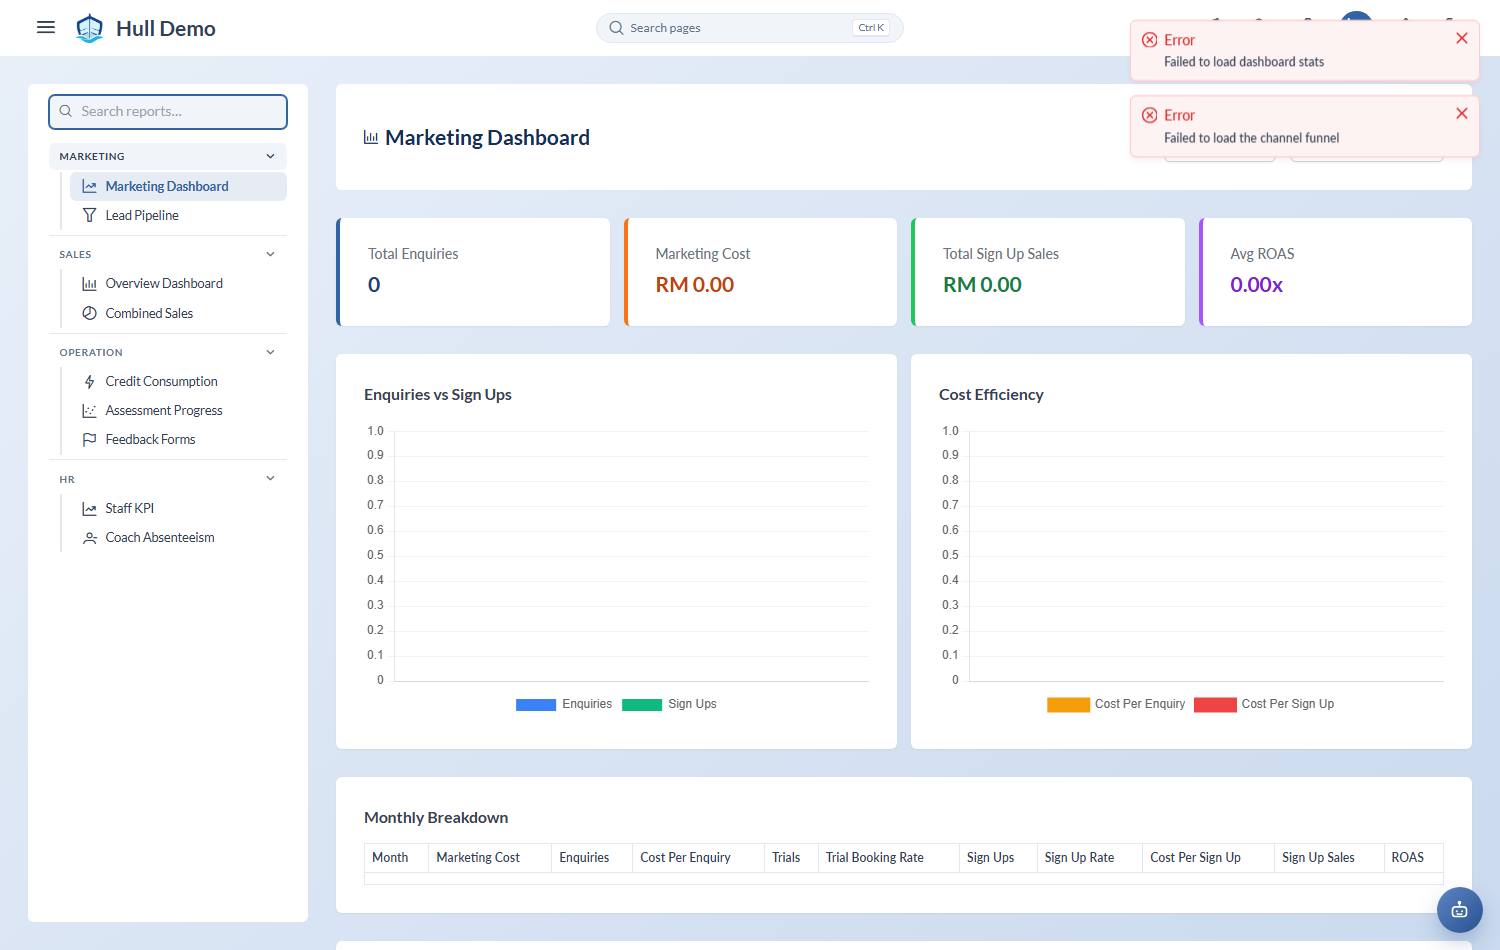
The funnel, month by month
| Column | What it tells you |
|---|---|
| Enquiries | how many people asked |
| Trials and Trial Booking Rate | how many of them you got into a class |
| Sign Ups and Sign Up Rate | how many of those became paying families |
| Marketing Cost | what you spent |
| Cost Per Enquiry and Cost Per Sign Up | what each was worth |
| Sign Up Sales and ROAS | what came back for what you spent |
Read it as three separate problems
The funnel breaks in different places and each break has a different fix. Comparing months, look at *which rate* moved:
- Enquiries down. A reach problem. Spend, or the channel itself.
- Enquiries fine, trial booking rate down. A response problem. How fast, and how well, does someone answer the enquiry?
- Trials attended fine, sign-up rate down. A conversion problem — the trial experience, the price, or nobody following up afterwards.
Only the first is fixed by spending more money, and it is the one people reach for first.
Cost per sign-up is the number that matters
Cost per enquiry flatters channels that generate curiosity. Cost per sign-up tells you what a paying family costs, which is the number you can compare against what a family is worth to you over their life at the academy.
Where the numbers come from
Trials, sign-ups and sales are derived from what actually happened. Cost arrives on its own for any channel with a connected ad account, and is typed in for the rest.
Enquiries now count themselves too — but only the real ones. A new customer opening a chat on a number you have marked as an *enquiry line* counts; an existing parent asking to move a class does not, and neither does a conversation your team started. Walk-ins are still yours to record, and a figure you type always wins over the counted one. See Know where your enquiries come from.
That means ROAS is only as honest as the cost entry. If cost is missing for a period, the return figures are not calculated rather than estimated — a blank here is the system refusing to make something up.
Do not forget referrals
Referrals rarely show up as marketing spend and are usually the highest-quality channel you have. Check the referral programme's cost against these figures before concluding that paid channels are doing the work.
Connecting your ad accounts
Meta and Google ad spend can sync automatically: from the Connections screen, Connect sends you to the platform's own consent page, you pick which ad account to pull from and which marketing channel its cost belongs to, and spend starts arriving on its own.
The By Channel table
Underneath the funnel sits the same story per channel: spend, enquiries, trials, attended, sign-ups and cost per sign-up, for a whole year or one month of it, with an Unattributed row for everything that could not be traced. Cost figures for the period divide only by the channels that actually carried spend, so one untracked channel cannot flatter the rest.
Beside it: the Lead Pipeline
Reports → Lead Pipeline answers the question this dashboard cannot: not how many enquiries, but where they are stuck — how many sit at each step, how many arrived at each step in the period, and how long they stay. See Work the lead queue.
Related: Record the day's enquiries and spend · Set up your referral cycle · How revenue is counted.